You will need to use Google Chrome. You can do it using other browsers but Google Chrome is the most convenient.
Why you should check the Network Activity
This is an important check, especially when a plugin is performing asynchronous actions (long-running process).
How to do it
Open your Google Chrome’s “Developer Tools” (https://developer.chrome.com/devtools) and click on the Network tab. Starts the process again until the issue occurs.
Go back to the Network tab, filter by XHR (those are the asynchronous requests, basically the discussion between your browser and the server, after the website has been loaded). Click on red colored request or the last request that was executed (in the left column, it’s usually admin-ajax.php) and look at the right window, in the XHR and Preview tab.
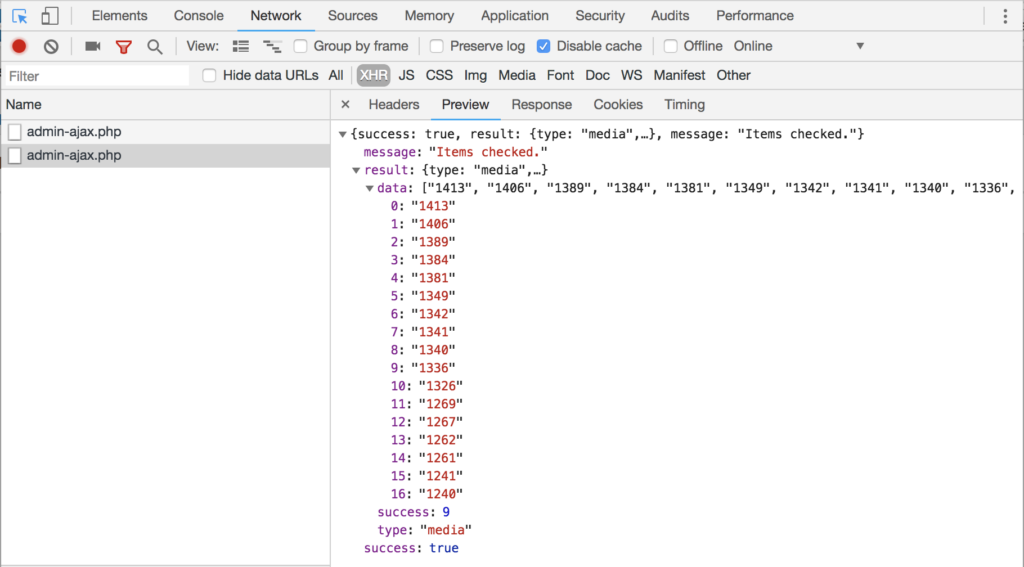
The Response tab might contain something interesting, like an error, or a broken reply from the server (if it is HTML, that’s also an issue as the message from the server is usually tiny and using JSON format). Please also check the Console window (look at the top of this window), as it might have some interesting information as well.